THIS POST MAY CONTAIN AFFILIATE LINKS. PLEASE SEE MY DISCLOSURES. FOR MORE INFORMATION.
 Debt is a normal part of life for many Americans.
We go into debt to buy houses, cars, to get an education, and on random things in the name of living life.
Some of us even go into debt to buy food and other essentials.
The problem with this is that debt holds us back.
When we are burdened with debt, we have few options in life.
For example, when you have a huge monthly student loan payment, if affects how much you can save for a house.
It even effects the type of jobs you apply for since you need a certain salary to make ends meet.
When you are in debt, you have a difficult time building wealth and reaching your financial goals.
With so much talk in the media about the ballooning student loan debt crisis and mountains of credit card debt outstanding, I wanted to take a deeper look at the health of the American household when it comes to debt.
I was looking to find answers to questions like:
- Is there really that much debt out there?
- How much is the average American in debt?
- How much debt does a 25 year old have?
- How much debt do the Baby Boomers have?
I did a lot of research and thanks to the Federal Reserve, the New York Federal Reserve, Experian, and Charles Schwab I was able to pull some current data.
This is the most current data, as of the third quarter of 2019.
My plan is to update these stats as new information is released and compare the changes over time.
Table of Contents
US Consumer Debt Statistics
US Total Consumer Debt
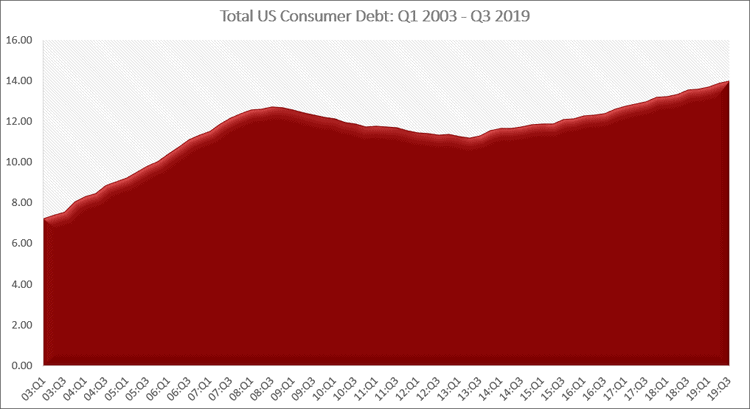
The first stat we are going to look at is total US household consumer debt.
As of the third quarter of 2019, total consumer debt has reached $13.95 trillion dollars.
This is an increase of 3% from the same time 1 year ago and an increase of over 16% since 2014.
You may be wondering what makes up total consumer debt?
Here is a breakdown of the types of consumer debt we are talking about:
- Mortgage debt
- Home equity debt
- Auto loan debt
- Credit card debt
- Student loan debt
- Other debt
The chart below is the same as the one above.
Only this time, it is broken down by the type of consumer debt.
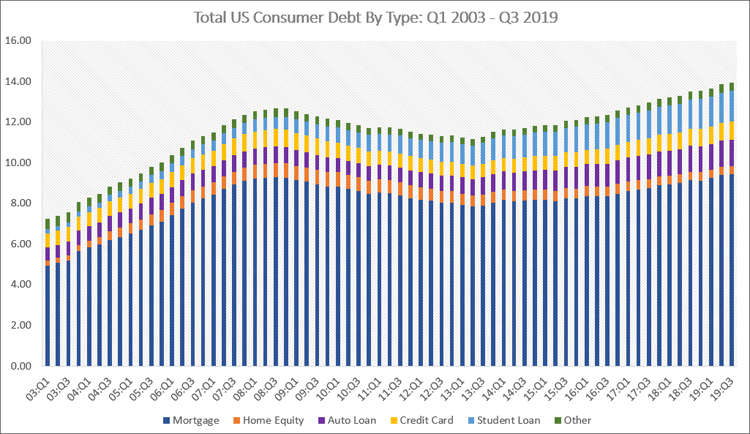
As you can see, mortgage debt makes up the largest piece of total debt, followed by student loans, auto loans and credit cards.
The biggest takeaway from these 2 charts is after the Great Recession, Americans began paying down their debts.
This was from 2009 (09:Q1) to roughly 2013 (13:Q3).
Since then, debt levels have slowly increased across the board.
Now that we see the total consumer debt, how does this break down to the average US household?
The average debt for a US Household is over $136,000!
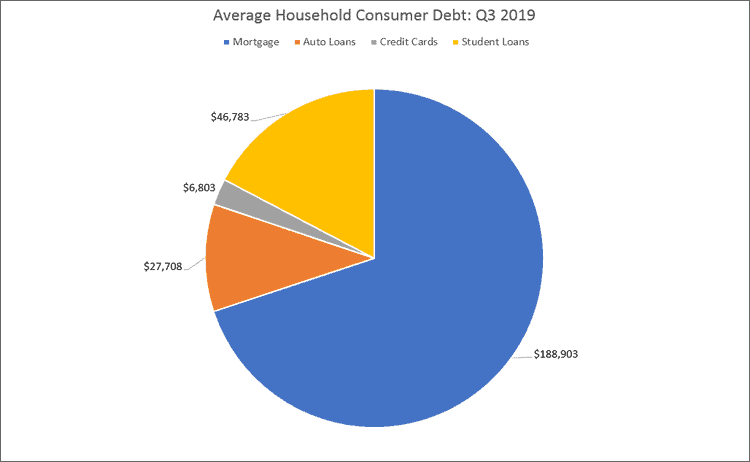
It makes sense that mortgages make up the majority of this number since this is the largest loan most will take out in their lives.
But what this chart doesn’t show us is whether or not the debt levels of the US household is growing or shrinking over time.
It also doesn’t tell us what debts US households are taking on at a faster rate. I’ll dive into this in the next section.
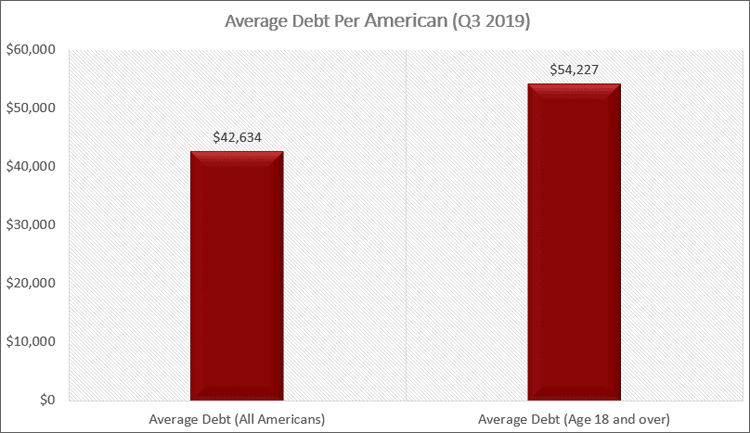
For now, let’s see how this amount of debt affects every American.
If we break the debt number down further, it comes to $42,634 per American. This includes every age group, including those just born!
If we exclude those under 18 years old, the average debt per person in the US is $54,227!
Below I will discuss each type of consumer debt and look for trends over time to see how Americans are dealing with debt.
Mortgage Debt
As was mentioned before, mortgage debt is the largest piece of debt for most US households.
It totals close to $9.50 trillion dollars, or 68% of total consumer debt.
While mortgage debt levels dropped after the Great Recession, this had more to do with the stagnant real estate market than it did with people working to get out of debt.
The issue is that as housing prices rise, the amount of mortgage debt is going to rise as well.
While consumers can save more for a down payment, at the end of the day, most put down just enough to buy the house and then are saddled with large monthly mortgage payments.
Below is a chart showing the average mortgage debt per state. This is based on a per capita level.
Credit Card Debt
Even though mortgages make up the majority of consumer debt, the other debt numbers are troubling.
Credit card debt makes up just 6% of the total debt but totals $880 billion!
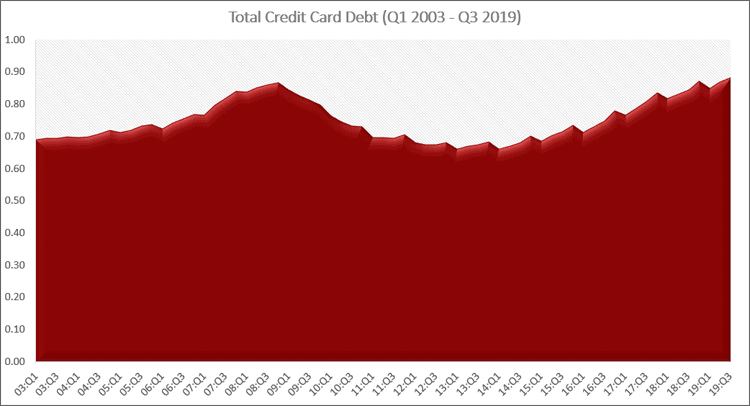
Broken down further, the average US Household has over $6,000 in credit card debt.
Since most people have double-digit interest rates on this debt, it makes sense to pay this debt off first and foremost.
As you can see from the chart, Americans did a good job of paying down this debt after the Great Recession.
Unfortunately it looks like the pain experienced is now forgotten as credit card debt levels match those right before the recession began.
Below is another chart showing the average credit card debt by state.
Just hover over a state to see the average debt someone living there has.
Auto Debt
Another important debt number to look at is auto debt.
Auto debt comes in at over $1.32 trillion. This comes to roughly $27,000 per household and makes up 9% of overall consumer debt.
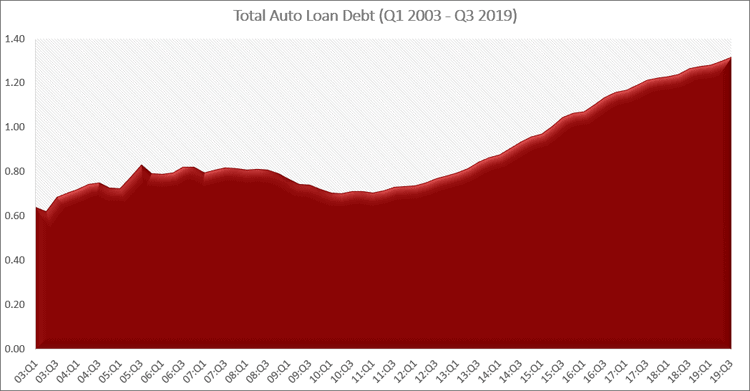
But this doesn’t tell the whole story.
When you dig deeper, the numbers get troubling.
- The average price for a new car is $37,577 according to Kelly Blue Book
- The average length of a new car loan is 69 months and 65 months for a used car loan according to Experian
- Average monthly payment for a new car is $554 and $391 for a used car (Experian)
- The average monthly lease for a new car is $457 (Experian)
All of these numbers are increases over the prior year.
The scariest part is that the average loan is over 5 years.
This means a lot of people are taking out loans of 6 or more years just to get a lower monthly payment, presumably to afford the car.
Below is a chart showing the average auto loan debt by state. This chart is on a per capita basis, meaning the numbers are based on a per person basis.
Student Loans
It seems you can’t go a day without hearing of the ticking time bomb that is student loan debt.
The average American holds $46,783 worth of student loan debt, which is 11% of total consumer debt.
You can see from the chart below how the outstanding amount of student loan debt has ballooned.
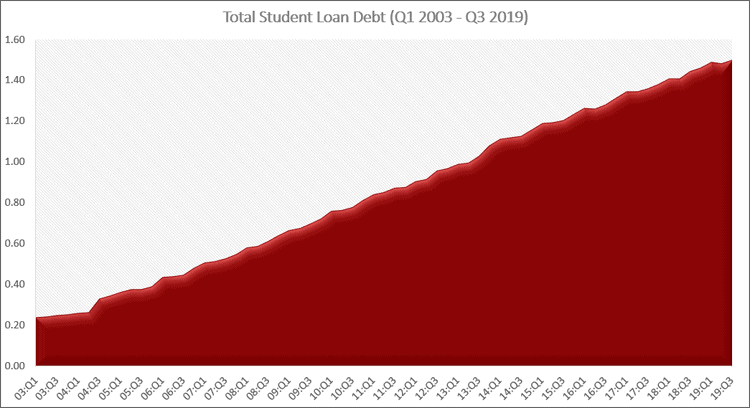
Back in 2003, there was $240 billion outstanding. Today, the number has swelled to $1.5 trillion.
This is an increase of 84%!
Sadly the increases don’t look to be slowing as from 2018 to 2019 the percentage change is close to 5% higher.
Here are some more disturbing quick facts about student loan debt.
- Student loan debt is the largest consumer debt behind mortgages.
- Out of all the debts analyzed, student loan debt is the fastest growing debt.
- Since 2010 student loan debt has grown 4 times faster than credit card debt and 8.5 times faster than mortgage debt.
Here is a great breakdown of the average student loan debt by state.
Simply hover over the state to see the average for that state.
Consumer Debt By Age
We saw what total consumer debt looks like, but now let’s break it down by age group.
When we look at these numbers, we see some interesting findings.
Below is a chart of of the breakdown of debt types by age group.
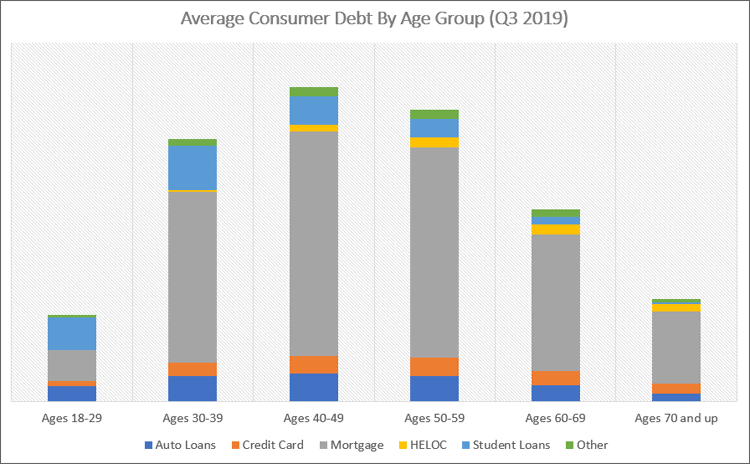
As you can see, debt increases as we get older and then begins to drop off.
This makes sense since after college you have student loan debt, and then take on auto debt, a mortgage, and some credit card debt.
But once you are established in your home and career, debt levels begin to lower as you pay off your debt.
The issue though is this is a general stereotype of what should happen.
As we will see from looking at each age group, paying off debts across the board as you age is not reality.
Ages 18-29
In this age group, total debt stands at $970 billion dollars.
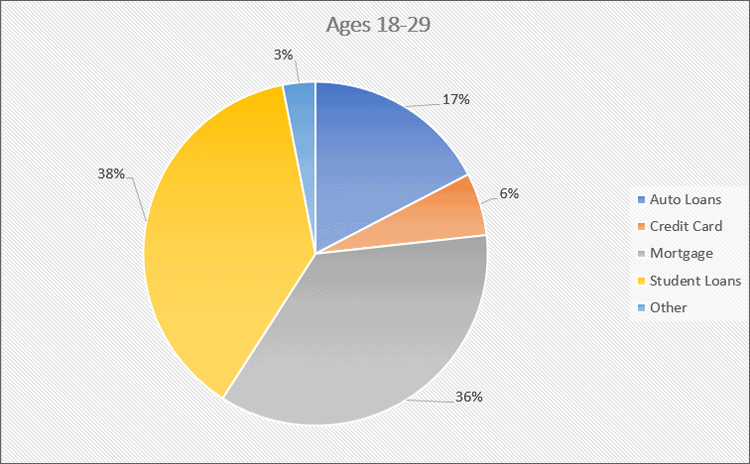
It isn’t surprising that student loans make up the biggest piece of the pie, coming in at $370 billion dollars or 38% of total debt.
What is surprising is that mortgages make up the next largest debt, making up 36% of total debt.
This is surprising based on the reports of people having to put off buying a house due to student loan payments.
The good news here is that credit cards only make up 6% of the debt owed, but is still $60 billion dollars.
Ages 30-39
In the 30-39 age group, total debt balloons 67% to $2.93 trillion dollars.
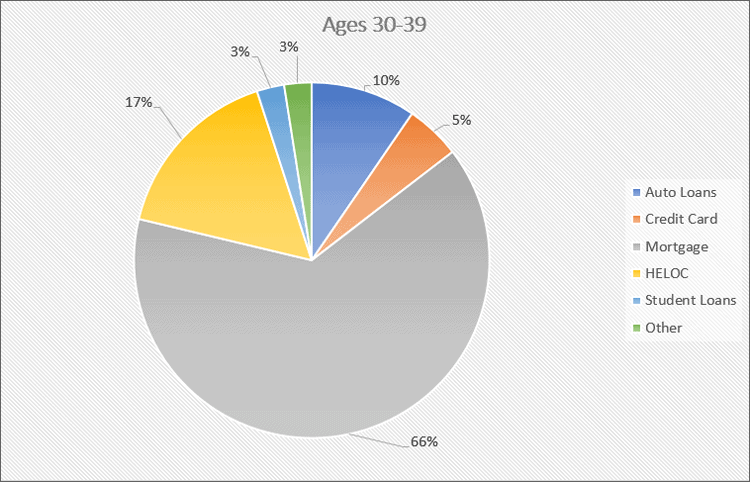
This time however, mortgages make up the majority of the debt, 65% or $1.90 trillion.
Students loans come in second at $490 billion dollars. This is an increase of 25% versus the 18-29 age group.
In terms of dollars, student loan debt grows by $120 billion dollars.
The assumption is that this number includes those attaining a professional degree and those going back to college for more education.
Finally, another reason could be borrowers making smaller payments or even deferring payments until their income grows.
Another area of growth is with credit cards. For the 18-29 age group, there was $60 billion worth of credit card debt.
But for this age group, it jumps to $150 billion dollars.
Ages 40-49
For the 40-49 age group total debt grows to $3.51 trillion, an increase of 17%.

Once again, mortgages make up a significant amount of this debt, $2.51 trillion dollars or 72%.
The good news is that while student loans still come in as the second largest percent of total debt at 9%, the total outstanding dollar amount drops to $320 billion.
This is a 35% decrease.
The bad news is credit card debt continues to grow, now reaching $200 billion and auto debt grows to $310 billion dollars.
So while the average 40-49 year old consumer is paying down their student loan debt, they are taking on more credit card and auto debt.
Ages 50-59
For those aged 50-59, total debt stands at $3.26 trillion dollars. This is a decrease of 7% or $250 billion dollars.

The good news is that most debts are declining for this age group.
For example:
- Mortgage debt decreases 6% to $2.34 trillion
- Auto loans drop 7% to $280 billion
- Student loans drop 34% to $210 billion
But there is some bad news for this age group.
Credit card debt is rising. It grew 10% to $210 billion.
Another debt that is growing is home equity lines of credit. They grew 36% to $110 billion.
There could be any numbers of reasons for this, from home remodeling to borrowing to help pay for their children’s education.
Ages 60-69
As retirement is approaching, how well are consumers with debt?
For the 60-69 age group, the answer is not great.
In fact, this age group has $2.14 trillion in consumer debt.
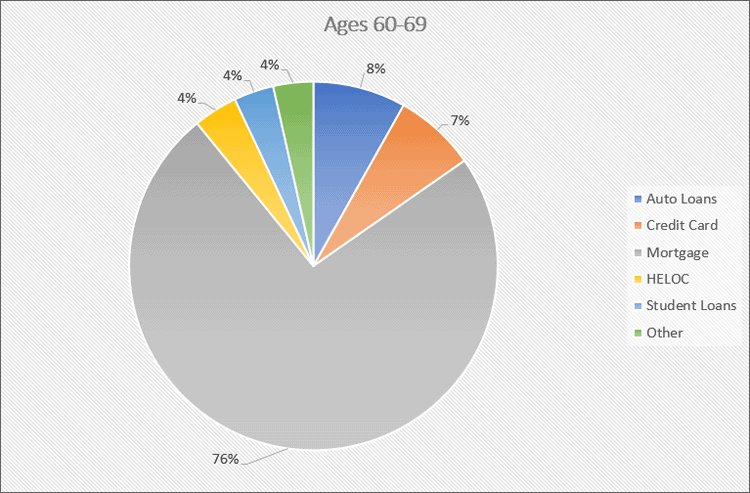
The good news however is this amount of consumer debt is down 34% compared to the 50-59 age group.
And even better news is that all of the types of debt are seeing lower balances as well.
- Mortgage debt down 34% to $1.53 trillion
- Credit card debt down 23% to $160 billion
- Auto loan debt down 35% to $180 billion
- Student loan debt down 22% to $90 billion
But, the reality is this age group still carries a lot of debt, which makes saving for and planning for retirement difficult.
Ages 70 and Up
Finally, those aged 70 and older continue the trend of lower debt levels across the board.
Their total outstanding consumer debt stands at $1.15 trillion, a decrease of 46%.
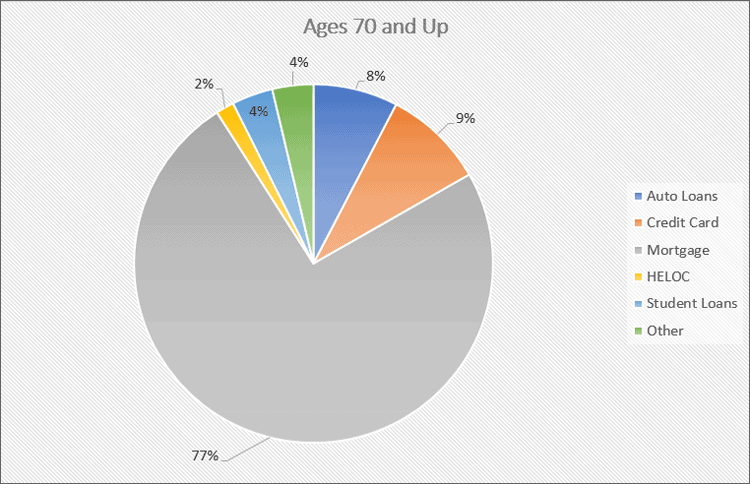
As with the previous age group, all debt types are decreasing, which is good.
- Mortgage debt down 47% to $810 billion
- Credit card debt down 31% to $110 billion
- Auto loan debt down 49% to $90 billion
- Student loan debt down 77% to $20 billion
The scary part however is Americans in their 70s are still carrying both mortgage debt and student loan debt into retirement!
This makes it tough to enjoy your golden years when you have so much debt hanging over your head.
Other Debt Statistics
There are a couple more stats about consumer debt I want to share with you because they are so powerful.
Credit Card Debt To Income
First is the credit card debt to income statistic.
In the chart below, you see the average amount of credit card debt per income range.
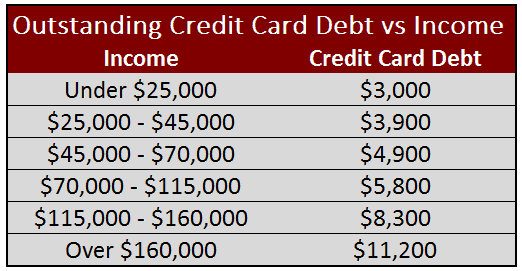
What this shows us is that as income rises, so does credit card debt.
The question is, is this because the wealthier you are, the more likely you are to pay for things in credit vs cash and as a result, this data shows a high amount of credit card debt?
Or does this mean that as incomes rise, more people are trying to show off their success by living a life that is beyond their means?
Unfortunately I have not found any data that can answer this question at this time.
Spending And Social Media
An interesting finding came from the 2019 Modern Wealth Survey.
It found that 60% of survey respondents pay more attention to how their friends spend money versus how they save.
And when they see friends and family members posting about the extravagant vacations and fabulous dinners, they not only wonder how they afford the lifestyle but also try to keep up.
Interestingly however, these people blame social media for their own bad money choices and not their friends and family, whom they are trying to keep up with.
And this isn’t just with the younger generation either.
It is true across the board.
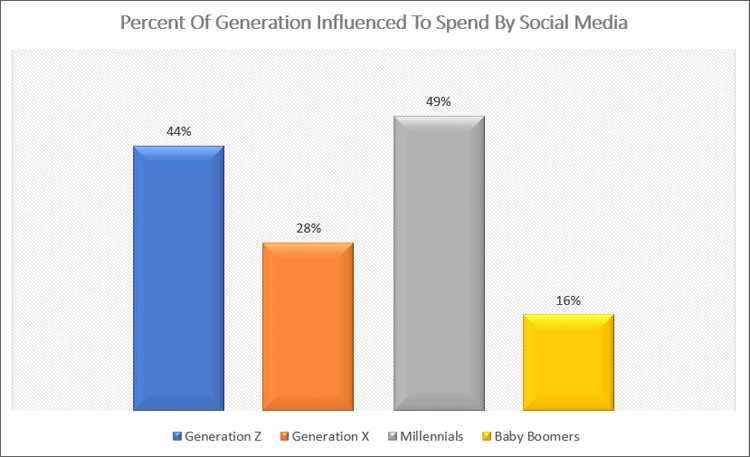
At the end of the day, social media adds to the “fear of missing out” or FOMO feeling and as a result, many try to keep up even when they cannot afford to.
What These Consumer Debt Statistics Tell Us
So what does all of this information on average debt tell us?
It tells that while the average American is doing better financially compared to the financial crisis, they still have a lot to improve upon.
And while I would love to sit here and tell you that all debt is bad and you should avoid it like the plague, this doesn’t make sense.
Some debt can help you improve your situation when used strategically.
For example, debt allows you to buy a house which appreciates in value.
Student loan debt allows you to earn a college degree and increase your earning potential.
But the key is to only take on debt that you can afford to repay.
This is how so many people got into trouble with housing. They bought a house they couldn’t afford.
They took out a max loan that the bank approved them for, thinking that if the bank approves them for the loan, then the house is affordable.
This is false thinking.
Sadly, many college kids are now repeating this same mistake.
They are taking out crazy amounts of student loan debt because they are approved for them.
Remember, the government and banks out to make money, not to make sure you can afford the loan you take out.
Yes, they have guidelines so that there is a likelihood of repayment, but there is no guarantee.
Final Thoughts
At the end of the day, regardless of your age bracket or income level, Americans are in debt.
While not all debt can be avoided, it is critical that you make smart decisions when it comes to going into debt and not over extend yourself.
The reason for this is simple.
When you are in debt, you are working to earn an income that is going to someone else, the loan company.
All those hours you work are essentially to pay someone else, not yourself.
Added to this, when you are in debt, your life is stuck within a boundary.
You have fewer options because you have to pay back your debt.
And finally, you have the potential added stress and headaches that come along with debt.
The bottom line is to try to be as smart as you can when it comes to debt.
Take out only what you truly need and nothing more. Avoid consumer debt.
And whatever debt you do have, make it a point to pay it back as quickly as possible.
I have over 15 years experience in the financial services industry and 20 years investing in the stock market. I have both my undergrad and graduate degrees in Finance, and am FINRA Series 65 licensed and have a Certificate in Financial Planning.
Visit my About Me page to learn more about me and why I am your trusted personal finance expert.

Free 7 Day Beat Debt Boot Camp
Learn how to finally break free from your debt in 7 days! Includes a FREE debt snowball calculator!
By signing up you agree to our terms